| Overall | 14W 7L 0T |
| District | 9W 3L 0T |
| Expected | 18: 0+ 3- |
":" = Games won or lost as expected,
"+" = Games won against stronger team,
"-" = Games lost against weaker team)
|
14 2 2 Rank in State, Class, District |
1273 38 Strength Momentum |
1050 58.4(17) SOS, RPI(RPI Rank) |
":" = Games won or lost as expected, "+" = Games won against stronger team, "-" = Games lost against weaker team) | |
| Date | Opponent1 | RGWF4 | Opp Strength | Result | Expectation2 | Playing Strength | P(Win)3 | Send |
|---|---|---|---|---|---|---|---|---|
| 08/25/15 | Belen | 0.000 | 975 | W 4- 3 | Expected (-2) | 1162 | 82% |  |
| 08/27/15 | St. Pius | 0.000 | 1289 | L 0- 6 | Worse (-6) | 965 | 50% | |
| 09/01/15 | at East Mountain | 0.001 | 952 | W 5- 1 | Expected (+1) | 1325 | 80% | |
| 09/04/15 | St. Michael's ? | 0.002 | 1262 | L 1- 2 | Worse (-1) | 1206 | 54% | |
| 09/08/15 | at Albuquerque | 0.003 | 1514 | L 1- 3 | Expected (+1) | 1305 | 22% | |
| 09/11/15 | Bloomfield | 0.001 | 918 | W 9- 0 | Expected (+5) | 1548 | 86% | |
| 09/15/15 | Bosque ?? | 0.011 | 1185 | L 0- 1 | Worse (-2) | 1167 | 63% | |
| 09/17/15 | Kirtland Central ! | 0.002 | 1050 | W 10- 0 | Expected (+8) | 1670 | 76% | |
| 09/22/15 | Rehoboth Christian | 0.007 | 739 | W 9- 0 | Expected (+3) | 1459 | 94% | |
| 09/25/15 | Piedra Vista | 0.048 | 1001 | W 5- 2 | Expected (0) | 1276 | 80% | |
| 09/26/15 | Hobbs !! | 0.048 | 1280 | W 5- 1 | Expected (+4) | 1466 | 51% | |
| 10/01/15 | Navajo Prep | 0.015 | 669 | W 10- 0 | Expected (+4) | 1479 | 96% | |
| 10/02/15 | at Kirtland Central | 0.096 | 1050 | W 4- 1 | Expected (+1) | 1324 | 72% | |
| 10/07/15 | at Hope Christian | 0.211 | 1392 | L 2- 4 | Expected (-1) | 1244 | 33% | |
| 10/13/15 | at Bosque | 0.352 | 1185 | W 3- 2 | Expected (0) | 1291 | 58% | |
| 10/15/15 | at Rehoboth Christian | 0.077 | 739 | W 9- 1 | Expected (+3) | 1428 | 92% | |
| 10/22/15 | at Navajo Prep | 0.118 | 669 | W 8- 0 | Expected (+2) | 1392 | 95% | |
| 10/23/15 | at Bloomfield | 0.335 | 918 | W 5- 0 | Expected (+2) | 1359 | 83% | |
| 10/24/15 | Hope Christian | 0.540 | 1392 | L 0- 3 | Expected (-2) | 1170 | 38% | |
| 11/05/15 | * Bosque | 0.934 | 1185 | W 2- 1 | Expected (0) | 1291 | 60% | |
| 11/06/15 | * Hope Christian | 0.995 | 1392 | L 0- 1 | Expected (0) | 1294 | 36% | |
|
Notes: 1Games against an opponent in the same district are shown in bold letters; may NOT be an actual district game Numbers in parentheses for reported games are the goals Sandia Prep actually scored, relative to what ratings predicted 2Numbers listed for unreported/future games are the most probable winning margin 3P(Win) is the expected winning Percentage -- the statistical success rate for predicting the game winner between teams of this strength difference 4RGWF is the relative weight factor for this game * Game at a neutral site, or unable to determine which team gets home field advantage |
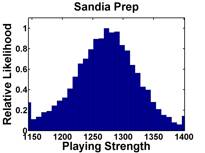
The median opponent strength is 1050, while
Sandia Prep's "weighted playing strength" is 1288
(where a win by 4 goals counts 0.69 as much as a 1 goal win, and
a game played on 10/17/15 counts 0.5 that of one played on 11/07/15)
Go back to ratings for Boys Varsity Girls Varsity Main Page